Summary of the World’s Top Five Automotive Semiconductor Companies in 2025 and Outlook for 2026
After four years, the global automotive semiconductor market declined again. Market size evolution:
- 2019: approx. USD 37.2 billion
- 2020: declined to USD 35.5 billion due to the pandemic
- 2021: +31.5% to USD 46.7 billion
- 2022: +26% to USD 58.8 billion
- 2023: +16% to USD 68.2 billion
- 2024: slight decline of 4% to USD 65.4 billion
- 2025: continued decline of about 4%
After years of rapid growth, the automotive semiconductor market has entered a downturn. In 2025, the hardest-hit segments are MCUs and power semiconductors.
Since 2024, competition in electric vehicles has shifted from range and charging speed to intelligence. At the same time, extended-range vehicles continue to erode the pure EV market. Demand for power semiconductors represented by SiC has collapsed. However, major manufacturers had previously been very optimistic about SiC and invested heavily in capacity expansion, leading to severe price competition.
As a result:
- Wolfspeed went bankrupt.
- SiC-focused manufacturers suffered heavy losses.
- STMicroelectronics’ revenue plunged.
- ON Semiconductor also joined the downturn.
- Renesas suffered massive losses after prepaying over USD 2 billion to Wolfspeed for SiC products.
- Infineon was also impacted, but thanks to strong high-end MCU demand, its overall revenue still grew slightly, though profits declined.
The MCU market is showing strong polarization:
- High-end MCUs are becoming increasingly expensive. NXP’s high-end MCU/MPU prices exceed USD 60, with very strong demand.
- Low-end MCU markets declined sharply. Combined with massive domestic MCU substitution in China, overall prices dropped by more than 30%.
Outlook for 2026
Low-end MCUs and power semiconductors—especially SiC—will remain the hardest-hit areas. Despite Wolfspeed’s bankruptcy and Renesas shutting down its SiC plant, oversupply remains severe due to:
- Slower EV market growth
- Competition shifting to intelligence
- Cancellation of subsidies
Price collapse is unavoidable.
However:
- Power management ICs are recovering and price wars are easing.
- High-end MCUs are driving strong growth in high-end power management chips.
- Shipments of high-end domain controllers continue to rise, boosting demand for high-side drivers and gate-driver MOSFETs.
1. NXP
NXP revenue, stock price and major acquisitions from 2010–2025
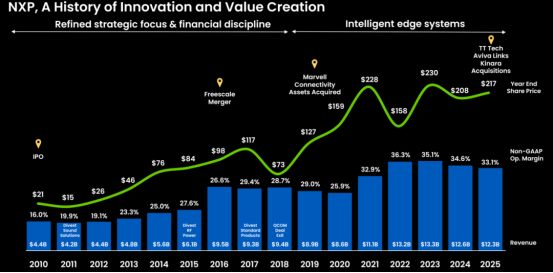
NXP operates in four business segments: Automotive, Mobile & Handheld, Industrial & IoT, and Communication Infrastructure. Automotive revenue share:
- 2023: 56%
- 2024: 57%
- 2025: 58%
In 2025:
- Total revenue: USD 12.3 billion (-2.8% YoY)
- Gross margin: 56.8% (vs 58.1% last year)
- Operating margin: 33.1% (vs 34.6% last year)
NXP forecasts:
- 2027 revenue: USD 16 billion
- Automotive revenue: USD 9.5 billion
- 2026 automotive growth: nearly 10%
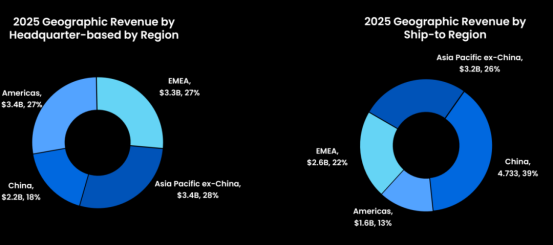
China is NXP’s largest market
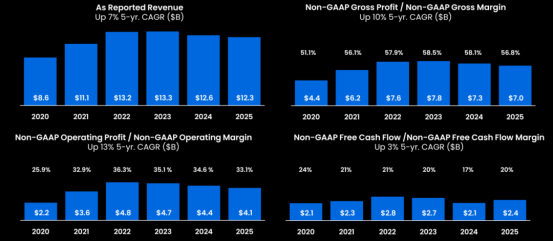
NXP revenue, gross margin, and operating margin (last 6 years)
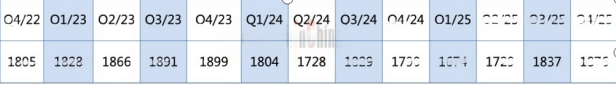
NXP automotive revenue (last 13 quarters)
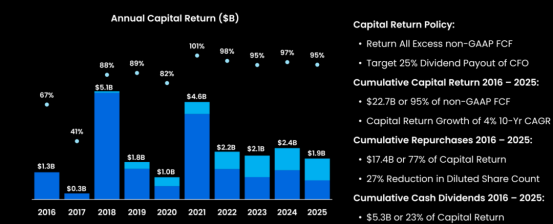
NXP return on capital (last 10 years)
Receivables, payables and inventory turnover (last 5 quarters)
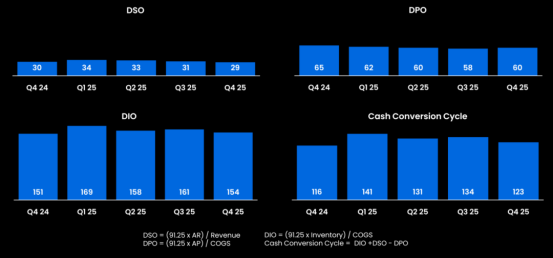
Inventory turnover days are declining, showing destocking progress. However, compared with the 116 days peak in Q1 2022, inventory remains much higher, indicating supply tightness is far lower than in 2022.
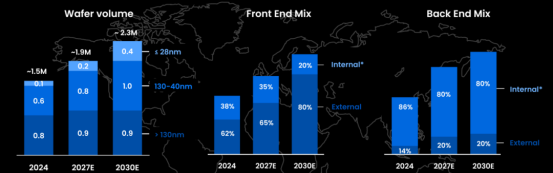
In 2024, NXP processed about 1.5 million wafers:
- 800k above 130nm
- 600k between 40–130nm
- 100k below 28nm
Front-end manufacturing in-house: 40% Expected to drop to:
- 35% in 2027
- 20% in 2030 Back-end manufacturing: 80% still in-house
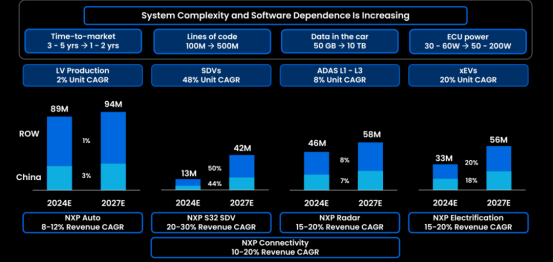
NXP identifies four high-growth areas:
- S32 series MPU
- Radar transceivers
- Electrification
- Wireless connectivity
Recent acquisitions:
- Dec 17, 2024: USD 242.5 million acquisition of Aviva Links (SerDes technology, up to 16 Gbit/s)
- Jan 7, 2025: USD 625 million acquisition of TTTech Auto (automotive middleware company)
- Oct 2025: USD 307 million acquisition of Kinara (programmable NPU for edge AI)
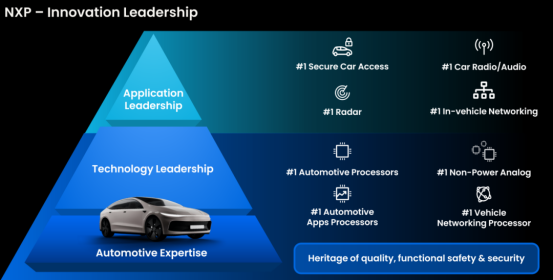
NXP ranks global No.1 in:
- Car keys
- Radio
- Audio amplifiers
- mmWave radar
- In-vehicle networking
- Non-power analog
- Gateways
In 2024:
- Expanded UWB investment
- First UWB mass production in Audi vehicles
- First UWB in battery management
- Launched i.MX94 application processors
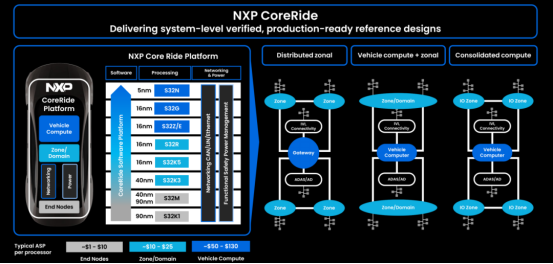
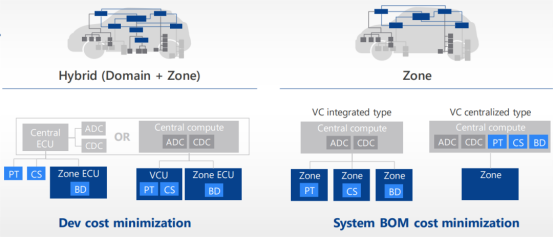
NXP CoreRide supports SDV (Software Defined Vehicle) architecture. S32N55 (5nm) is the world’s first non-cockpit ADAS chip for gateways and central computing platforms. S32N79 will launch in 2026.
2. STMicroelectronics
2025 revenue declined 11.1% to USD 11.8 billion (vs -23.2% in 2024). Gross margin:
- 2023: 47.9%
- 2024: 39.3%
- 2025: 33.9%
Operating margin dropped to only 4.7%. Losses are likely in 2026.
Automotive revenue:
- 2024: -14%
- 2025: -24%
Automotive share:
- 2024: 46%
- 2025: 39%
Reasons:
- 2024: MCU revenue collapsed 39%
- 2025: Power devices (especially SiC) collapsed, heavily dependent on Tesla, with price cuts over 30%
Expected 2026 decline: ~20%.
Despite downturn, ST acquired NXP MEMS business in Feb 2026 for USD 950 million.
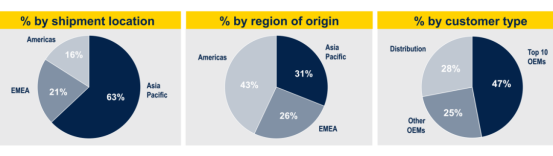
– 2025 revenue distribution
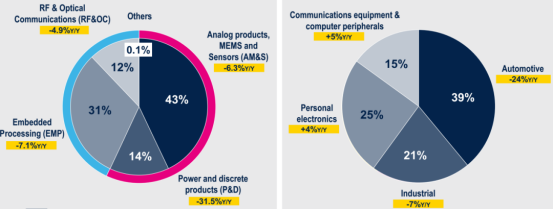
– End-market distribution
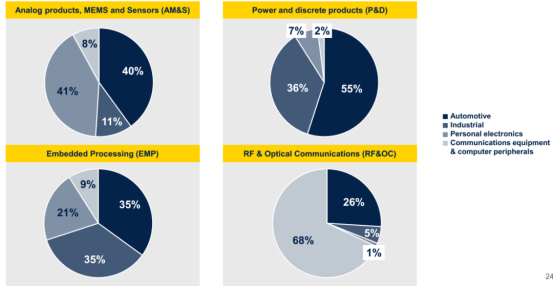
– Regional distribution
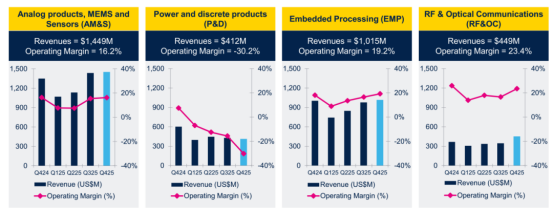
– Division revenue and margins
ST is:
- No.1 in Tesla SiC supply
- No.2 in automotive high-voltage MOSFET
- No.3 in discrete IGBT
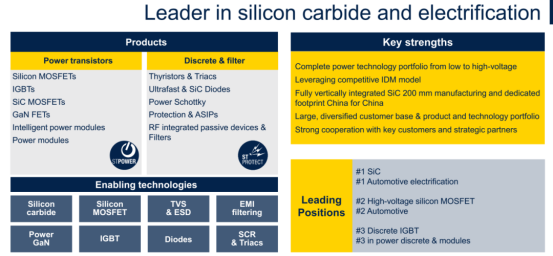
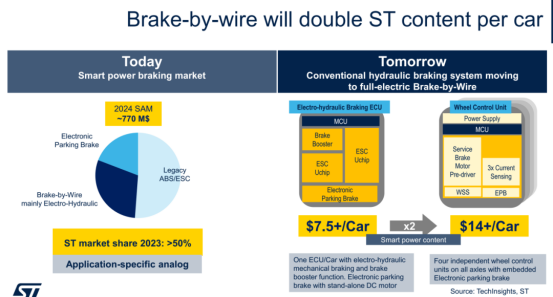
Brake systems market share exceeds 50%. EPB penetration approaching 100%.
High-current gate-control MCUs: global No.1
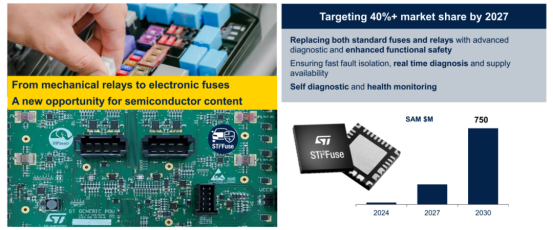
Electronic fuses: strong advantage
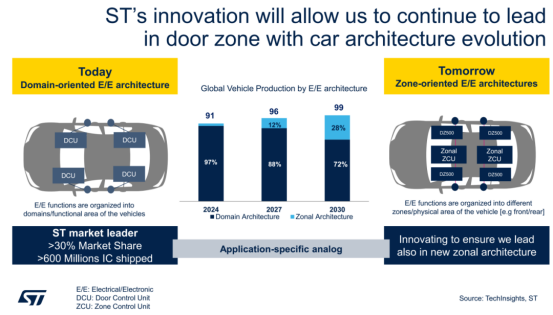
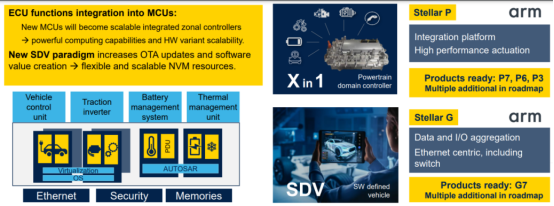
STELLAR MCU series targets powertrain and networking, supports 160°C and PCM memory. Bosch is its largest customer.
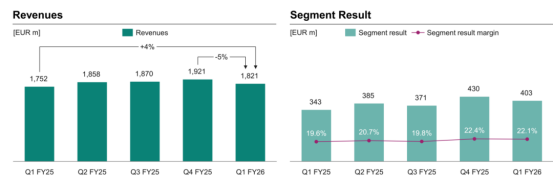
3. Infineon
Automotive revenue:
- 2023: USD 8.62 billion
- 2024: USD 8.40 billion
- 2025: USD 8.44 billion
Total revenue:
- 2024: USD 14.9 billion (automotive 56%)
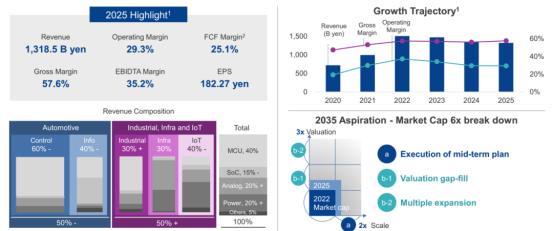
- 2025: USD 16.8 billion (automotive 50%)
Order backlog end-2025: EUR 21 billion Expected 2026 growth: 5–7%
Major acquisitions:
- Aug 2025: USD 2.5 billion acquisition of Marvell automotive Ethernet
- Feb 2026: EUR 570 million acquisition of ams-OSRAM sensor business
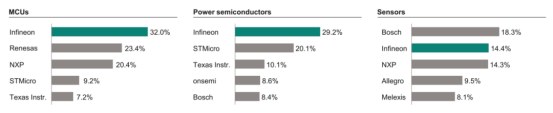
Market share ranking
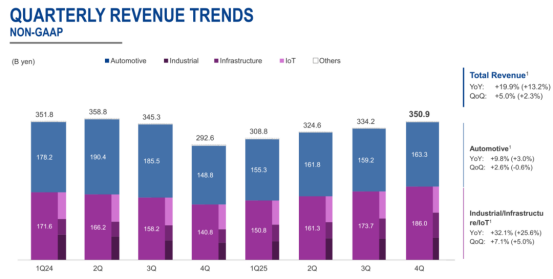
Quarterly revenue & margin
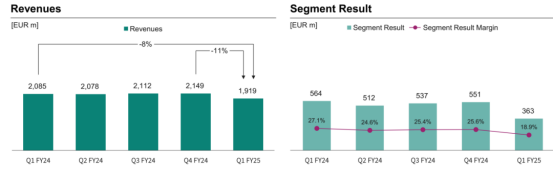
Automotive quarterly revenue
– Key customers
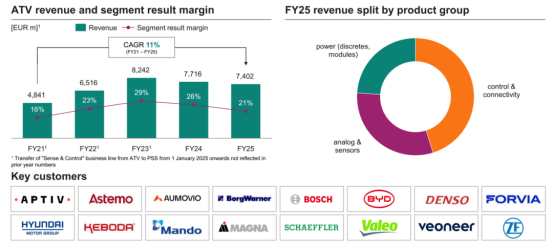
Product mix:
- 2024: Power semiconductors 51%, MCU 38%, sensors+memory 11%
- 2025: Power 26%, MCU+Ethernet 47%, sensors+analog 27%
Major customers include BYD, Bosch, Continental, Denso, ZF, Magna, Hyundai, Toyota, BMW, Xiaomi, etc.
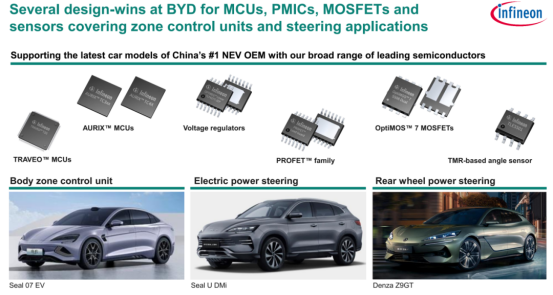
BYD cooperation
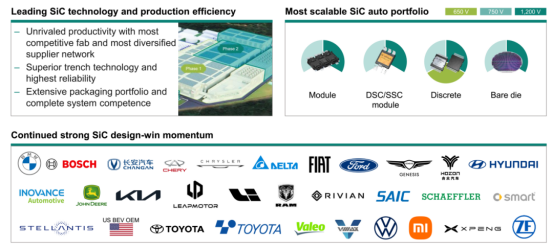
EV manufacturers using Infineon SiC
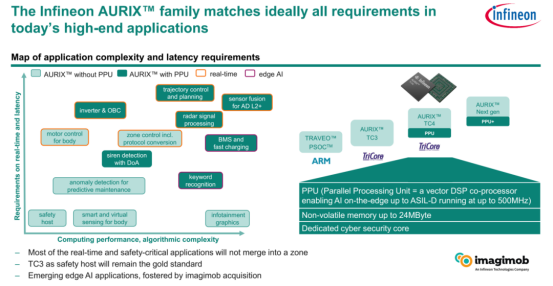
MCU product lineup
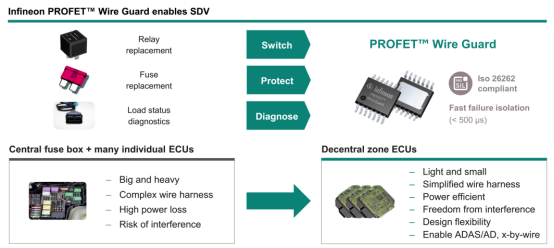
SDV requires intelligent relays and fuses, best implemented with MOSFETs.
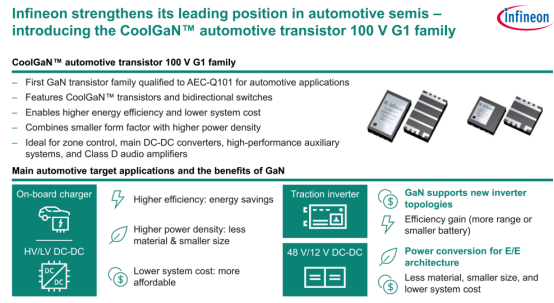
Infineon also leads in automotive GaN.
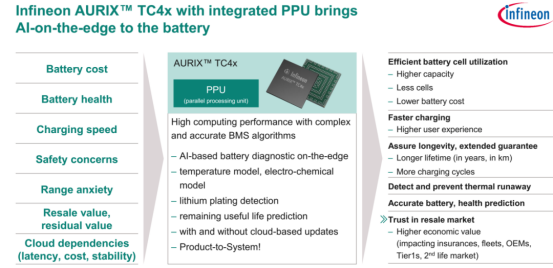
TC4X is Infineon’s next-generation MCU for complex vector algorithms.
4. Renesas
2025 revenue: JPY 1.3185 trillion (USD 8.79 billion), -1.6% YoY Automotive revenue: USD 4.26 billion (-8.4%)
Gross margin: 54.1% Operating margin: 30.7%
Losses due to:
- JPY 237.6 billion write-off related to Wolfspeed support
- USD 2 billion SiC prepayment converted to equity after Wolfspeed bankruptcy
- Closure of Gunma SiC plant
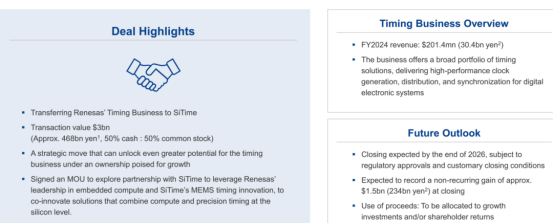
Feb 2026: plan to sell timing business to SiTime for USD 3 billion.
Automotive revenue (8 quarters)
Product mix
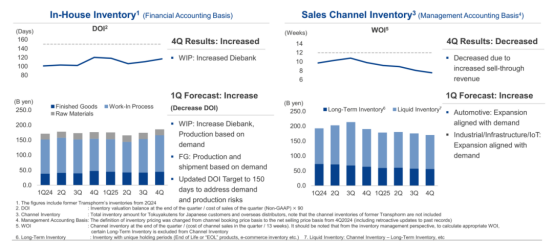
Inventory trend
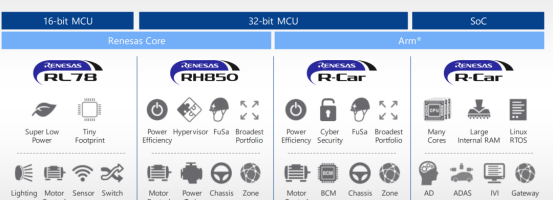
Renesas strengths:
- Lighting, body, motor, cockpit
- High-end MCU U2A16 used mainly by Chinese manufacturers
- Entering ADAS MCU market dominated by Infineon
Zonal MCU strategy
Product lines
Timing business sale MOU
5. Texas Instruments
2025 revenue: USD 17.68 billion (+13%) Gross margin: 56.9%
By segment:
- Analog: USD 14.0 billion (+15%)
- Embedded: USD 2.7 billion (+6.5%)
- Other (DLP, custom): USD 0.98 billion (+3.4%)
Embedded still below 2023 peak (USD 3.37 billion). Growth driven mainly by analog products. Expected 2026 growth: under 5%.
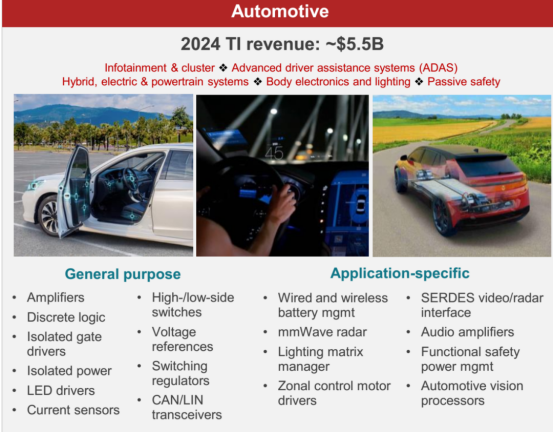
Automotive product distribution
End-market revenue (2025):
- Industrial: 33%
- Automotive: 33%
- Data center: 9%
- Personal electronics: 21%
- Communications: 3%
Automotive revenue:
- 2024: USD 5.5 billion
- 2025: USD 5.8 billion
- 2026 forecast: <5% growth
We track the biggest discounted part numbers from different franchised distributors
Why do we track the biggest discounted part numbers across franchised distributors worldwide?
It comes down to market dynamics: each franchised distributor supports unique major end customers, creating pockets of concentrated demand. This focus locks in the deepest discounts and gives them stronger “pull-in” power for faster deliveries from the OCM. As a result, different distributors hold unique advantages in different parts.
The challenge? These distributors cannot efficiently collaborate with a widespread, unfamiliar customer base.
Our goal is to move beyond transactional sourcing and establish a stable, formal, and long-term cooperation that delivers sustained value and supply chain reliability.
Looking for datasheets, product specs, or our company profile?
- 📧 Email: frank.cheung@icnets.com
- 🌐 Website: www.icnets.com
- 🏢 Company: ICNets — Connecting the Global IC Networks
Documents available:
- Company Profile (PDF)
- ISO Certificates 9001/1920
- ERAI member
- Product Line Cards
- Quality Control Procedure
- Technical Datasheets
Get in touch directly via WhatsApp or WeChat:

Disclaimer:
The views and information shared here are solely based on my personal understanding and experience in the electronic components and supply chain industry. This post is intended for informational and educational purposes only and does not constitute any form of commercial, investment, or procurement advice.
Market insights and price observations are derived from public information and personal analysis, which may not be fully comprehensive or up to date. Readers should use their own discretion.
Some materials, charts, and data are sourced from public databases or third-party platforms for non-commercial sharing; all copyrights belong to their respective owners.
The opinions expressed here do not represent the views of my employer or any affiliated organisation.